blog
solar soars in 2018 new plant construction
but lags in capacity
Hondo Lane | August 14, 2020
(Petrolytics) - The EIA released earlier this week data concerning US electricity generator construction in 2018. And while 2020 has certainly shaken things up, assessing generator construction (even as a lagging indicator) is informative. This is especially true given the long-lead time in construction.
Key points:
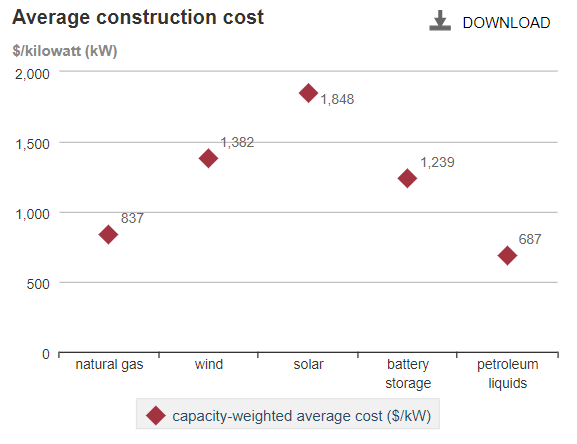
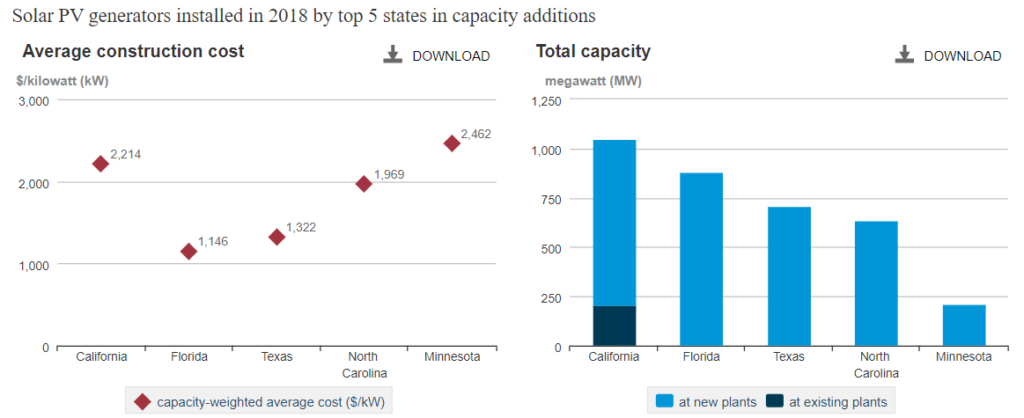
- Solar exhibits highest avg construction cost in 2018 at $1,848/kW
- Petro. liquids exhibit lowest avg construction cost in 2018 at $687/kW
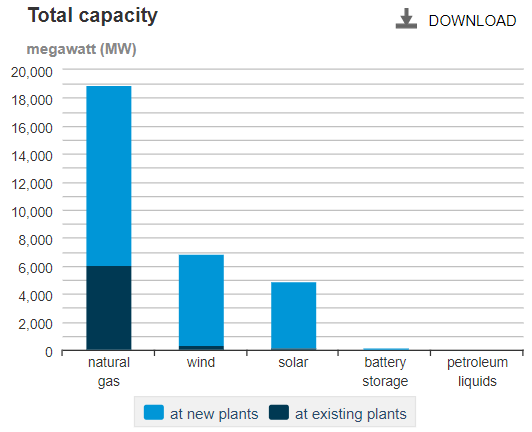
- Natural gas saw greatest capacity additions at new plants and at existing facilities
- Petro. liquids saw lowest capacity additions at new plants and at existing facilities (might explain low avg construction costs)
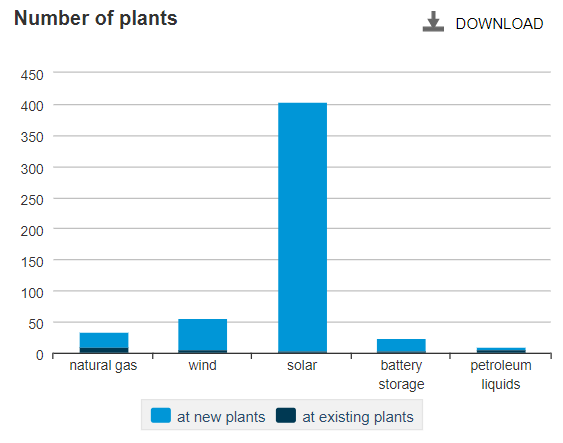
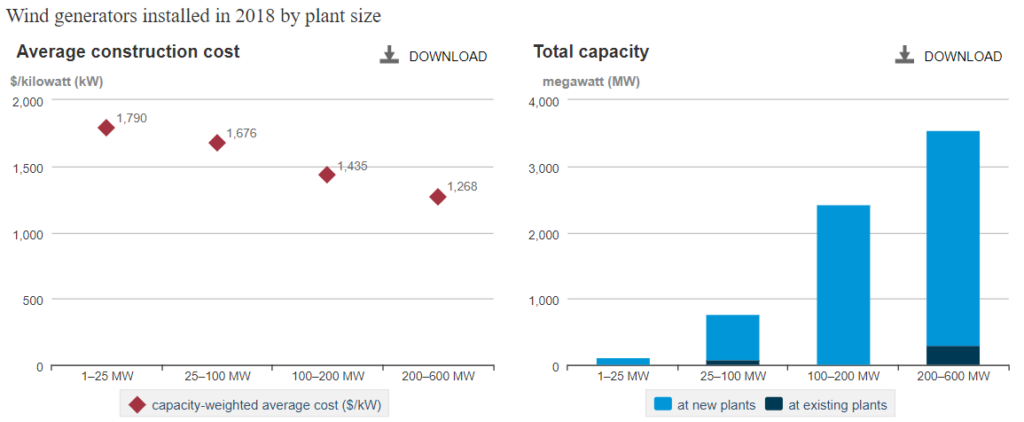
- New solar plants dwarfed all other plants at +400 in 2018
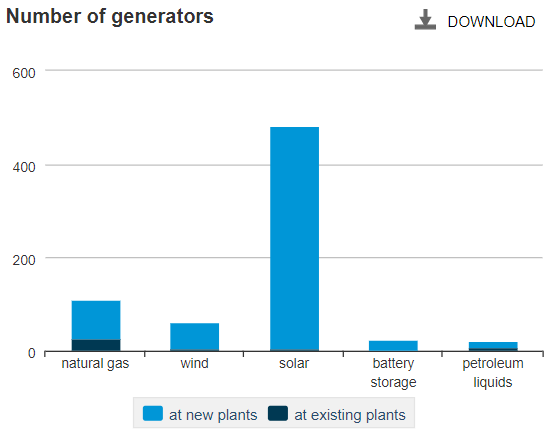
- Similarly, solar generators dwarfed all other sources at +475 in 2018
While the South Census Region saw the lowest avg construction costs and greatest amount of added capacity, the West saw the highest avg construction costs and least amount of added capacity
Texas added the most capacity, but at the highest cost (probably due to new plant construction rather than incremental additions at existing facilities)
Additionally, while Texas leads in total new capacity, the state lags in solar PV capacity (behind California and Florida). Not surprisingly, however, is the significant amount of added wind capacity. While not explicitly broken out, we wouldn't be surprised to see Texas toward the top in terms of wind construction. Take a drive out near Snyder and you'll understand why.
Unfortunately for wind and solar, the battery storage capacity continues to lag. Perhaps things will pick up over the next few years, however, there doesn't appear to be much of an appetite (or capability) to build up battery storage. In any case, while natural gas lags in total new construction, it absolutely dominates in total added capacity. Cheap, clean(er) fuel.