blog
the state of oil, gas, and renewables
it's a mess
Hondo Lane | July 16, 2020
Oil & gas markets
(Petrolytics) - Despite tightening global oil inventories and increasing economic activity, OPEC+ will begin easing production cuts. The group expects the August and September 2020 cuts to be approximately 8.1-8.3 mmbopd; higher than the 7.7 mmbopd consensus (due to compensatory cuts by nations who fell short in previous periods).
Outside of OPEC+, a number of heavy-hitting headlines have crossed the wire. To summarize the more relevant:
- California Resources files for Ch.11 protection - California's largest E&P (~2 million acres) seeking relief from $5 billion in debt (didn't know any were left in CA)
- Norway eager to invest in domestic offshore - they're running the risk of a reduced resource base without additional investment
- Write-downs galore - while a number of high-profile impairments have plagued headlines recently, the widely-quoted EIA report of public write-downs is only a fraction of total value (below).
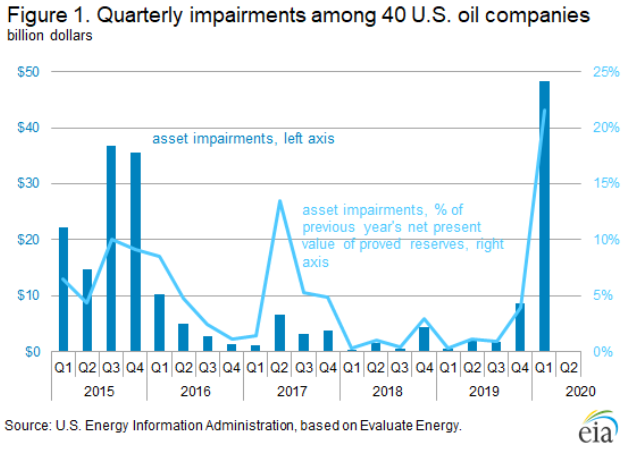
Interestingly enough, the EIA plot of quarterly write-downs includes only those companies which:
- Have a consistent set of publicly available financial information from 2015 through the first quarter of 2020
- Have a high oil production percentage and primarily operate in the United States
- Primarily engage in oil exploration and production, do not own refineries, and may have limited midstream assets.
This omission results in a significant gap in total write-down value. In fact, it's evident that a significant portion of total impairments is attributed to major players, as discussed in previous assessments.
See table below for the 40 companies included in the EIA quarterly plot.

Renewables
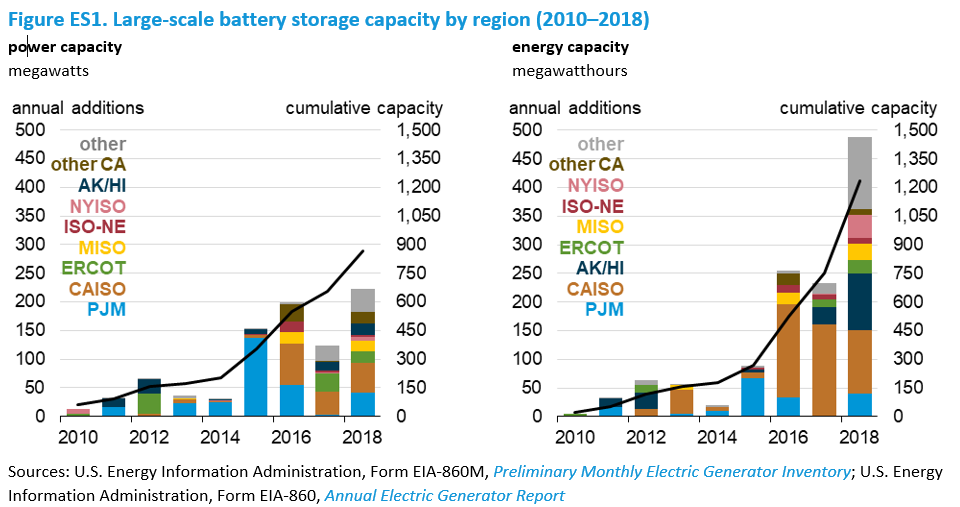
In the world of renewable energy,** large scale battery-storage systems** are increasingly being used at power plants, albeit on a small scale. Roughly 1,236 megawatthours of energy capacity of large-scale battery storage was in operation in 2018. Compare this to the 4.1 billion megawatthours of net generation in 2019.
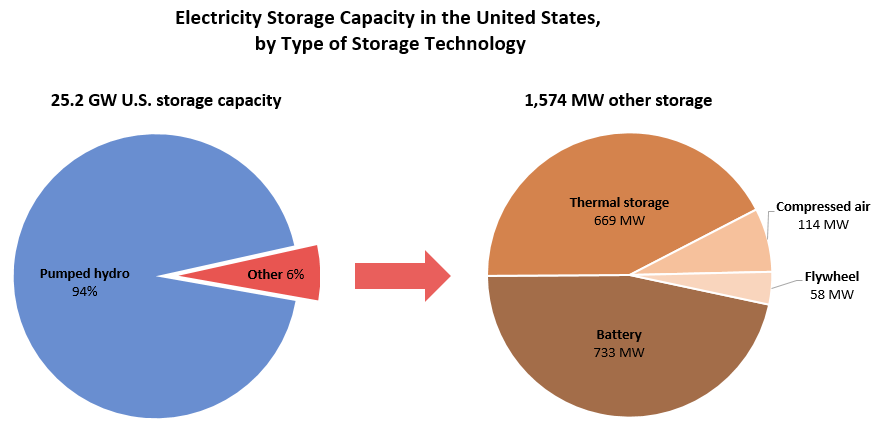
Furthermore, in terms of storage, pumped hydro continues to dominate the energy storage. Of the 25 GW of storage in the US, pumped hydro accounts for 23.5 GW (94% of total storage), while battery storage sits at roughly 870 megawatts (<3% of total storage).
Additionally, total photovolatic module shipments continue to rise with California and Texas taking the lead. 202o appears to be on track for a record year in terms of shipments, with, on average, 1.3 million peak kilowatts total shipments per month (at roughly $0.37 per peak watt).
Unfortunately, the EIA will not publicly disclose any more data with regard to photovolatic distribution (citing privacy concerns). In any case, solar panel shipments continue to rise in volume and decrease in cost.
As always, we’re interested to hear your thoughts on the pulse of the industry. Please reach out here or on Twitter with any insights, questions/concerns, or feedback. Our improvement is dependent on two-way dialogue.
Stay safe out there. Another triple-degree scorcher here in Texas. If it's not COVID, it's the heat.